Email: [email protected] Ligue agora! +55-11-3717-5537

Centralized Logging, Analysis, and Reporting
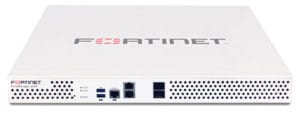
In today’s dynamic and fast changing security landscape, lack of visibility continues to extend breach and compromise events to an average of more than 100 days. For each day an organization is exposed it’s another opportunity for attackers to get to sensitive customer and confidential information. FortiAnalyzer delivers critical insight into threats across the entire attack surface and provides Instant visibility, situation awareness, real-time threat intelligence and actionable analytics, along with NOC-SOC security analysis and operations perspective for Fortinet’s Security Fabric.
Event Correlation & Advanced Threat Detection – Allows IT administrators to quickly identify and respond to network security threats across the network
Powerful NOC-SOC Dashboard – Customizable NOCSOC dashboards provide management, monitoring and control over your network.
Scalable Performance & Flexible Deployments – Supports thousands of FortiGate and FortiClient agents, and dynamically scale storage based on retention requirements. Deploys as an individual unit or optimized for a specific operation.
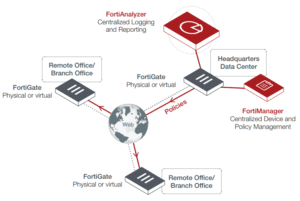
Fortinet Security Fabric can provide unified, end-to-end protection by deploying Fortinet Enterprise Firewalls to battle the advanced persistent threats, and adding FortiAnalyzer to expand the Security Fabric for increased visibility and robust security alert information that is both actionable and automated.
FortiAnalyzer enables you to collect, analyze and correlate log data from your distributed network of Fortinet Enterprise Firewalls from one central location, and to view all your firewall traffic and generate reports from a single console. With a subscription to FortiGuard Indicator of Compromise (IOC) service, it can provide a prioritized list for compromised hosts, so you can quickly take action.
FortiAnalyzer’s Incident Response capability improves Management & Analytics with focus on event management and identification of compromised endpoints. Use improved default and custom event handlers to detect malicious and suspicious activities on the spot. Integration of events with the FOS automation framework for automated endpoint quarantine. Incident detection and tracking, as well as evidence collection and analysis are streamlined through integration with ITSM platforms, helping to bridge gaps in your Security Operations Center and reinforce your Security Posture.
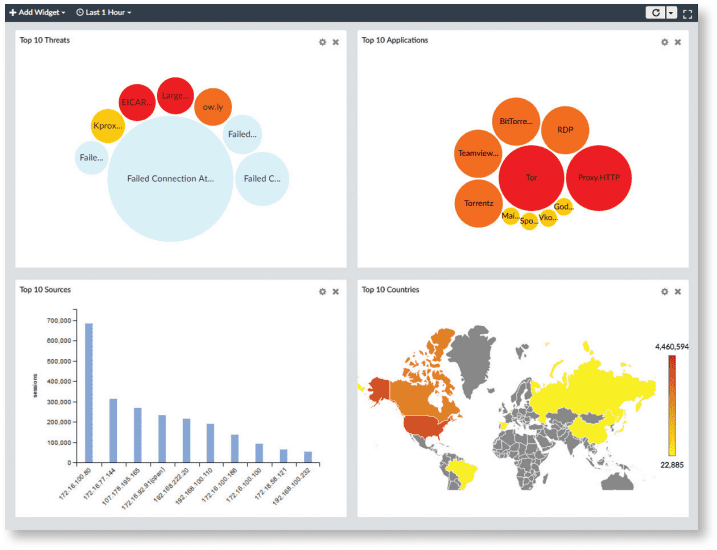
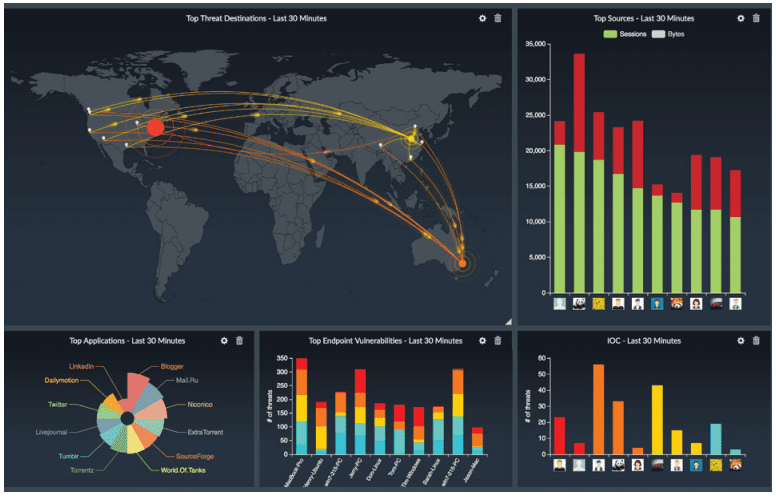
Provides a customizable interactive dashboard that helps you rapidly pinpoint problems, with intuitive summary views of network traffic, threats, applications and more. FortiView is a comprehensive monitoring system for your network that integrates real-time and historical data into a single view. It can log and monitor threats to networks, filter data on multiple levels, keep track of administrative activity, and more.
The Indicators of Compromise (IOC) summary shows end users with suspicious web usage compromises. It provides information such as end users’ IP addresses, host name, group, OS, overall threat rating, a Map View, and number of threats. You can drill down to view threat details. To generate the Indicators of Compromise, FortiAnalyzer checks the web filter logs of each end user against its threat database. When a threat match is found, a threat score is given to the end user. FortiAnalyzer aggregates the threat scores of an end user and gives its verdict of the end user’s overall Indicators of Compromise. The Indicators of Compromise summary is produced through the UTM web filter of FortiGate devices and FortiAnalyzer subscription to FortiGuard to keep its local threat database synced with the FortiGuard threat database.
You can generate custom data reports from logs by using the Reports feature. FortiAnalyzer provides 30+ built-in templates that are ready to use, with sample reports to help identify the right report for you. Run reports on-demand or on a schedule with automated email notifications, uploads and a easy to manage calendar view. Create custom reports with the 300+ built-in charts and datasets ready for creating your own custom reports, with flexible report formats include PDF, HTML, CSV and XML.
Event handlers define what messages to extract from logs and display in Event Management. You must enable an event handler to start generating events. You can configure event handlers to generate events for a specific device, for all devices, or for the local FortiAnalyzer unit. You can create event handlers for FortiGate, FortiCarrier, FortiCache, FortiMail, FortiManager, FortiWeb, FortiSandbox devices, and syslog servers. You can configure the system to send you alerts for event handlers via email address, SNMP community, or syslog server.
FortiAnlyzers NOC-SOC is a management center that helps you secure your overall network by providing actionalble log and threat data. The SOC helps you protect your network, web sites, applications, databases, servers and data centers, and other technologies, with centralized monitoring and awareness of the threats, events and network activity, using the predefined FAZ dashboards and widgets, or customize your own, delivered through a single-pane-of-glass interface for easy integration into your Security Fabric.
Log fetching is used to retrieve archived logs from one FortiAnalyzer device to another. This allows administrators to run queries and reports against historic data, which can be useful for forensic analysis. A FortiAnalyzer device can be either the fetch server or the fetching client, and it can perform both roles to retrieve the log data for a specified device and time period, based on specified filters. The retrieved data are then indexed, and can be used for data analysis and reports.
You can forward logs from a FortiAnalyzer unit to another FortiAnalyzer unit, a syslog server, or a Common Event Format (CEF) server. The client is the FortiAnalyzer unit that forwards logs to another device. The server is the FortiAnalyzer unit, syslog server, or CEF server that receives the logs. In addition to forwarding logs to another unit or server, the client retains a local copy of the logs. The local copy of the logs is subject to the data policy settings for archived logs. Logs are forwarded in real-time or near real-time as they are received. Forwarded content files include: DLP files, antivirus quarantine files, and IPS packet captures.
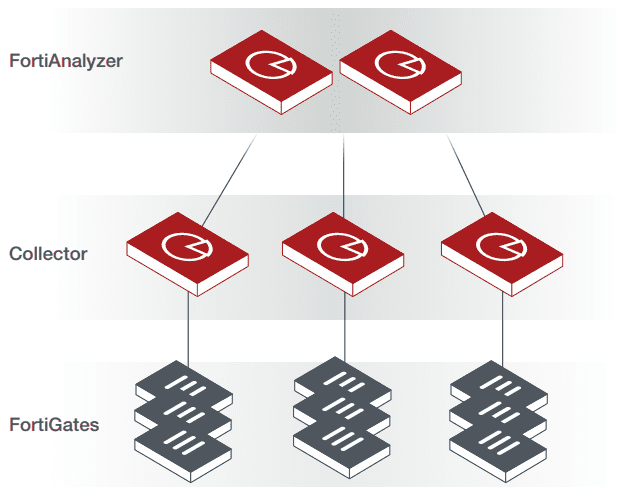
You can deploy in Analyzer mode and Collector mode on different FortiAnalyzer units and make the units work together to improve the overall performance of log receiving, analysis, and reporting. When FortiAnalyzer is in Collector mode, its primary task is forwarding logs of the connected devices to an Analyzer and archiving the logs. The Analyzer offloads the log receiving task to the Collector so that the Analyzer can focus on data analysis and report generation. This aximizes the Collector’s log receiving performance.
Time-based archive/analytic log data policy per Administrative Domain (ADOM), automated quota management based on the defined policy, and trending graphs to guide policy configuration and usage monitoring.
| FortiAnalyzer 200F | FortiAnalyzer 300F | FortiAnalyzer 400E | FortiAnalyzer 800F | |
|---|---|---|---|---|
| Capacity and Performance | ||||
| GB/Day of Logs | 100 | 150 | 200 | 300 |
| Analytic Sustained Rate (logs/sec)* | 3,000 | 4,500 | 6,000 | 8,250 |
| Collector Sustained Rate (logs/sec)* | 4,500 | 6,750 | 9,000 | 12,000 |
| Devices/VDOMs (Maximum) | 150 | 180 | 200 | 800 |
| Max Number of Days Analytics** | 40 | 28 | 30 | 30 |
| Options Supported | ||||
| FortiGuard Indicator of Compromise (IOC) | Yes | Yes | Yes | Yes |
| Hardware Specifications | ||||
| Form Factor | 1 RU Rackmount | 1 RU Rackmount | 1 RU Rackmount | 1 RU Rackmount |
| Total Interfaces | 2xRJ45 GE | 2xRJ45 GE, 2xSFP | 4x GE | 4 x GE, 2x SFP |
| Storage Capacity | 4 TB (1 x 4 TB) | 8 TB (2 x 4 TB) | 12 TB (4x 3 TB) | 16 TB (4x 4 TB) |
| Usable Storage (After RAID) | 4TB | 4TB | 6TB | 8TB |
| Removable Hard Drives | No | No | Yes | Yes |
| RAID Levels Supported | N/A | RAID 0/1 | RAID 0/1/5/10 | RAID 0/1/5/10 |
| RAID Type | N/A | Software | Software | Hardware / Hot Swappable |
| Default RAID Level | N/A | 1 | 10 | 10 |
| Redundant Hot Swap Power Supplies | No | No | No | No |
| Dimensions | ||||
| Height x Width x Length (inches) | 1.75 x 17.0 x 15.0 | 1.75 x 17.0 x 15.0 | 1.7 x 17.2 x 19.8 | 1.75 x 17.44 x 22.16 |
| Height x Width x Length (cm) | 4.4 x 43.2 x 38.1 | 4.4 x 43.2 x 38.0 | 4.3 x 43.7 x 50.3 | 4.4 x 44.3 x 56.3 |
| Weight | 17.1 lbs (7.8 kg) | 18.9 lbs (8.6 kg) | 31 lbs (14.1 kg) | 28.6 lbs (13.0 kg) |
| Environment | ||||
| AC Power Supply | 100–240V AC, 60–50 Hz | 100–240V AC, 60–50 Hz | 100–240V AC, 60–50 Hz | 100–240V AC, 60–50 Hz |
| Power Consumption (Max / Average) | 49 W / 114W | 65W / 130W | 93 W / 133W | 108W / 186W |
| Heat Dissipation | 390 BTU/h | 445 BTU/h | 456 BTU/h | 634 BTU/h |
| Operating Temperature | 32 – 104° F (0 – 40° C) | 32 – 104° F (0 – 40° C) | 41–95°F (5–35°C) | 32 – 104° F (0 – 40° C) |
| Storage Temperature | 95 – 158° F (-35 – 70° C) | 95 – 158° F (-35 – 70° C) | -40–140°F (-40–60°C) | 95 – 158° F (-35 – 70° C) |
| Humidity | 20 to 90% non-condensing | 20 to 90% non-condensing | 8–90% non-condensing | 20 to 90% non-condensing |
| Operating Altitude | Up to 7,400 ft (2,250 m) | Up to 7,400 ft (2,250 m) | Up to 9,842 ft (3,000 m) | Up to 7,400 ft (2,250 m) |
| Compliance | ||||
| Safety Certifications | FCC Part 15 Class A, C-Tick, VCCI, CE, UL/ cUL, CB | |||
| FortiAnalyzer 1000E | FortiAnalyzer 2000E | FortiAnalyzer 3000E | FortiAnalyzer 3700F | |
| Capacity and Performance | ||||
| GB/Day of Logs | 600 | 1,000 | 3,000 | 8,300 |
| Analytic Sustained Rate (logs/sec)* | 18,000 | 30,000 | 42,000 | 100,000 |
| Collector Sustained Rate (logs/sec)* | 27,000 | 45,000 | 60,000 | 150,000 |
| Devices/VDOMs (Maximum) | 2,000 | 2,000 | 4,000 | 10,000 |
| Max Number of Days Analytics** | 30 | 30 | 30 | 60 |
| Options Supported | ||||
| FortiGuard Indicator of Compromise (IOC) | Yes | Yes | Yes | Yes |
| Hardware Specifications | ||||
| Form Factor | 2 RU Rackmount | 2 RU Rackmount | 3 RU Rackmount | 3 RU Rackmount |
| Total Interfaces | 2x GE | 4x GE, 2 x SFP+ | 4x GE, 2 x SFP+ | 2xSFP+, 2x1GE |
| Storage Capacity | 24 TB (8x 3 TB) | 36 TB (12x 3TB) | 48 TB (16x 3 TB – 48 TB max) | 240 TB (60x4TB SAS HDDs) |
| Usable Storage (After RAID) | 18TB | 30TB | 42TB | 216TB |
| Removable Hard Drives | Yes | Yes | Yes | Yes |
| RAID Levels Supported | RAID 0/1/5/6/10/50/60 | RAID 0/1/5/6/10/50/60 | RAID 0/1/5/6/10/50/60 | RAID 0/1/5/6/10/50/60 |
| RAID Type | Hardware / Hot Swappable | Hardware / Hot Swappable | Hardware / Hot Swappable | Hardware / Hot Swappable |
| Default RAID Level | 50 | 50 | 50 | 50 |
| Redundant Hot Swap Power Supplies | Yes | Yes | Yes | Yes*** |
| Dimensions | ||||
| Height x Width x Length (inches) | 3.5 x 17.2 x 25.2 | 3.5 x 17.2 x 25.6 | 5.2 x 17.2 x 25.5 | 7 x 17.2 x 30.2 |
| Height x Width x Length (cm) | 8.9 x 43.7 x 68.4 | 8.9 x 43.7 x 64.8 | 13.2 x 43.7 x 64.8 | 17.8 x 43.7 x 76.7 |
| Weight | 52 lbs (23.6 kg) | 58 lbs (26.3 kg) | 76 lbs (34.5 kg) | 118 lbs (53.5Kg) |
| Environment | ||||
| AC Power Supply | 100–240V AC, 60–50 Hz | 100–240V AC, 60–50 Hz | 100–240V AC, 50–60 Hz, 11.5 Amp Maximum | 100–240V AC, 60–50 Hz |
| Power Consumption (Max / Average) | 192.5 W / 275W | 293.8 W / 354W | 449 W / 541W for 12 HDD | 850 W / 1423.4W |
| Heat Dissipation | 920 BTU/h | 1840 BTU/h | 1846.5 BTU/h | 4858 BTU/h |
| Operating Temperature | 41–95°F (5–35°C) | 50–95°F (10 – 35°C) | 50–95°F (10–35°C) | 50–95°F (10–35°C) |
| Storage Temperature | -40–140°F (-40–60°C) | -40–158°F (-40–70°C) | 40–158°F (-40–70°C) | -40–158°F (-40–70°C) |
| Humidity | 8–90% non-condensing | 8–90% non-condensing | 8–90% non-condensing | 8% to 90% (non-condensing) |
| Operating Altitude | Up to 7,400 ft (2,250 m) | Up to 7,400 ft (2,250 m) | Up to 7,400 ft (2,250 m) | Up to 7,000 ft (2133 m) |
| Compliance | ||||
| Safety Certifications | FCC Part 15 Class A, C-Tick, VCCI, CE, UL/cUL, CB | |||
* Sustained Rate – maximum constant log message rate that the FAZ platform can maintain for minimum 48 hours without SQL database and system performance degradation.
**is the max number of days if receiving logs continuously at the sustained analytics log rate. This number can increase if the average log rate is lower.
*** 3700F must connect to a 200V – 240V power source.
Clique aqui e responda nosso questionário!
Precisa comprar, renovar licença, instalar ou migrar seu equipamento ?
Planejamos sua aquisição, instalação, implantação ou migração, para mais informações faça contato com a TND Brasil através do telefone (11) 3717-5537 , e-mail [email protected] ou envie uma mensagem.